TotalView
Introduction
TotalView is a dynamic source code and memory debugging for C, C++, and Fortran applications and it includes memory debugging and analysis, Xeon Phi coprocessor, and OpenACC / CUDA debugging capabilities. This documentation will mainly focus on using TotalView's parallel debugging capabilities. RCC has a 64 token license for TotalView.
Using TotalView on HPC
A Note about TotalView 2018.2.6 and newer
Please note that the new version may not always display the source code when the program is called from the command line using mpirun -tv -np X EXECUTABLE_NAME. In order to get the source code to appear, a debugging session must be started manually from within the UI itself by going to File -> Debug a Parallel Program. You will have to select OpenMPI or MPICH from the drop-down list under "Parallel System" and you will have to browse for the executable under "File Name". The RCC team is aware of this issue and is working to resolve it.
Preparing the program
If it not already done, you have to compile your C/C++/Fortran program with -g flag for debugging. For example, a Fortran mat_mul_par.f90 should be compiled as,
mpif90 -g -o mat_mul_par mat_mul_par.f90
Interactively debugging a program with TotalView
The TotalView GUI needs x11 forwarding and interactive access to the machine(s) the program to be debugged is run. Therefore, you need to request an interactive computing session from SLURM resource manager. The following is an example.
srun --pty -t 30:00 -n 4 -p genacc_q /bin/bash
Here, --pty requests an interactive session so that TotalView GUI can start. The queue name is specified by -p option and the number of nodes and walltime should depend on the job. Note that requesting too many nodes and/or walltime may greatly increase your wait time (especially in the general access queue). This is not a good idea as you have to wait until this interactive job starts to use TotalView. Therefore, select a minimum amount of resources.
When your interactive session has started (i.e. when you get your terminal prompt back), you are ready to run your program and do some debugging. First load the TotalView module.
module load totalview
Then, change the directory to where you compiled your program and load the same mpi module used to compile it. Run your program with -tv option to mpirun. Example session would look like,
module load gnu-openmpi
mpirun -tv -np 4 mat_mul_par
where mat_mul_par is the name of my program and the number of workers is 4 (-np 4). Note that number of workers should be equal to or less than the number of processes requested when you start the session. This will open three windows as follows.
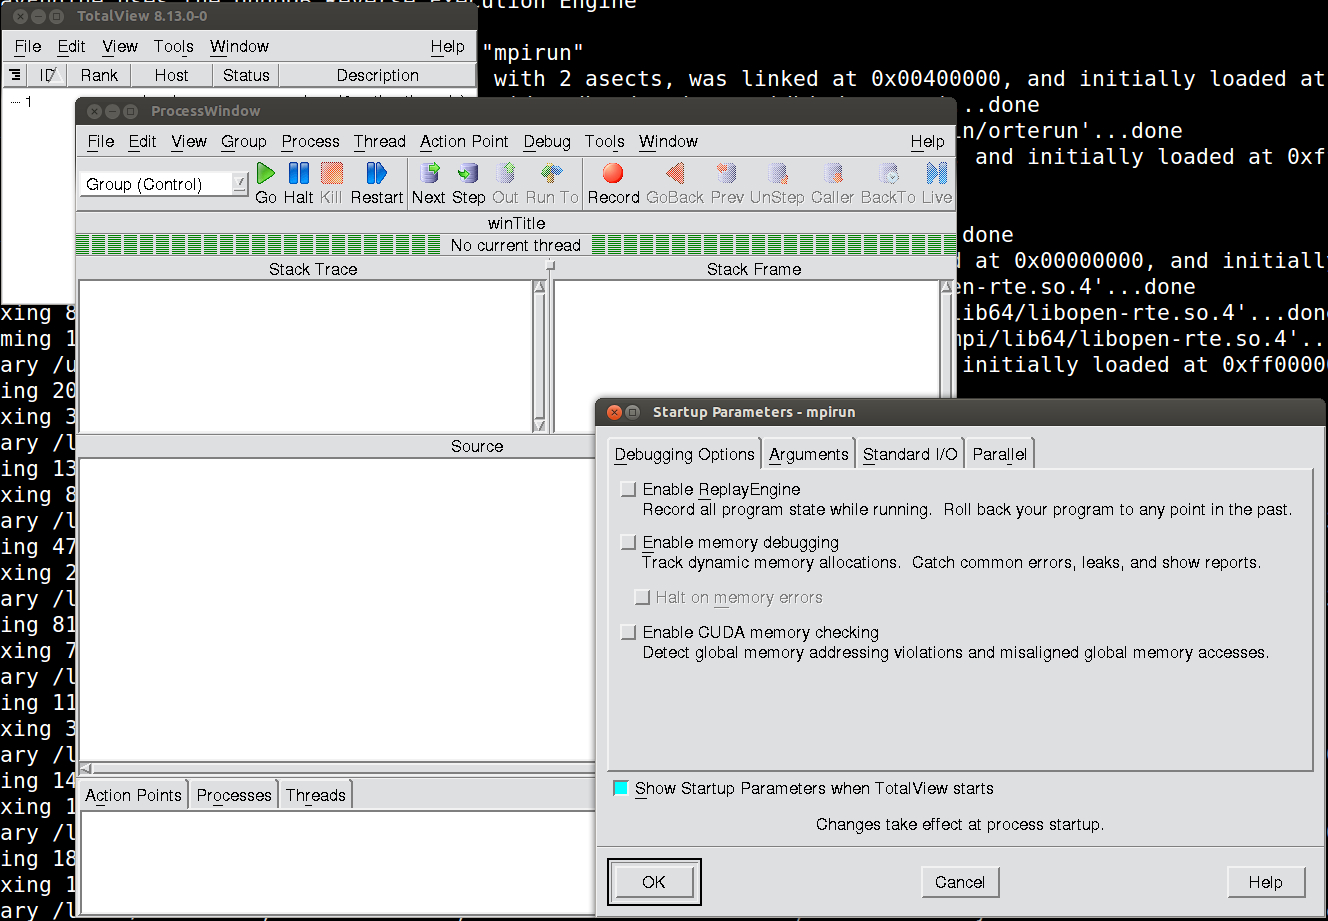
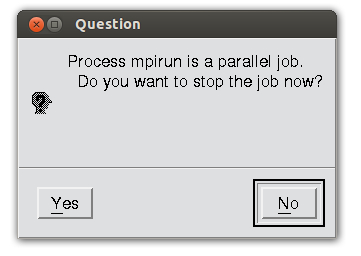
Click "OK" in the "Startup Parameters" window. If you are going to do memory debugging or need to record the program state while running, check the relevant boxes. You may notice there are lot of "stuff" going on in the terminal window and simply ignore those messages. Click the Go button in the Process window to start running your program. Click "OK" when the following message box appears.
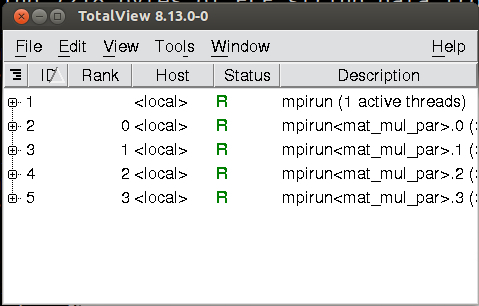
Now, your program will start running and you will see details about the workers (ID and Rank information) appear on the root window.
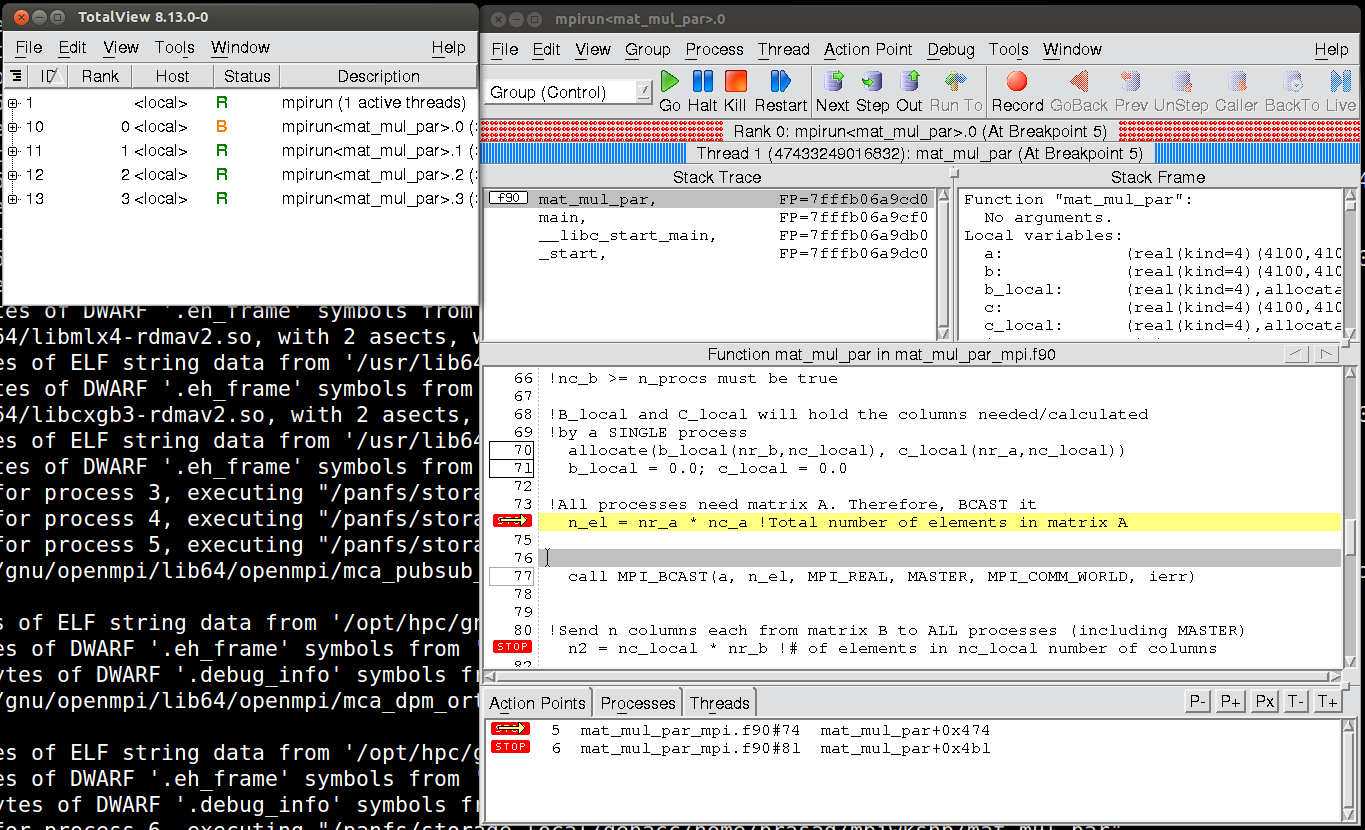
You may notice that TotalView is displaying information about mpirun itself. Click on main in the "stack trace" window to reveal your program.
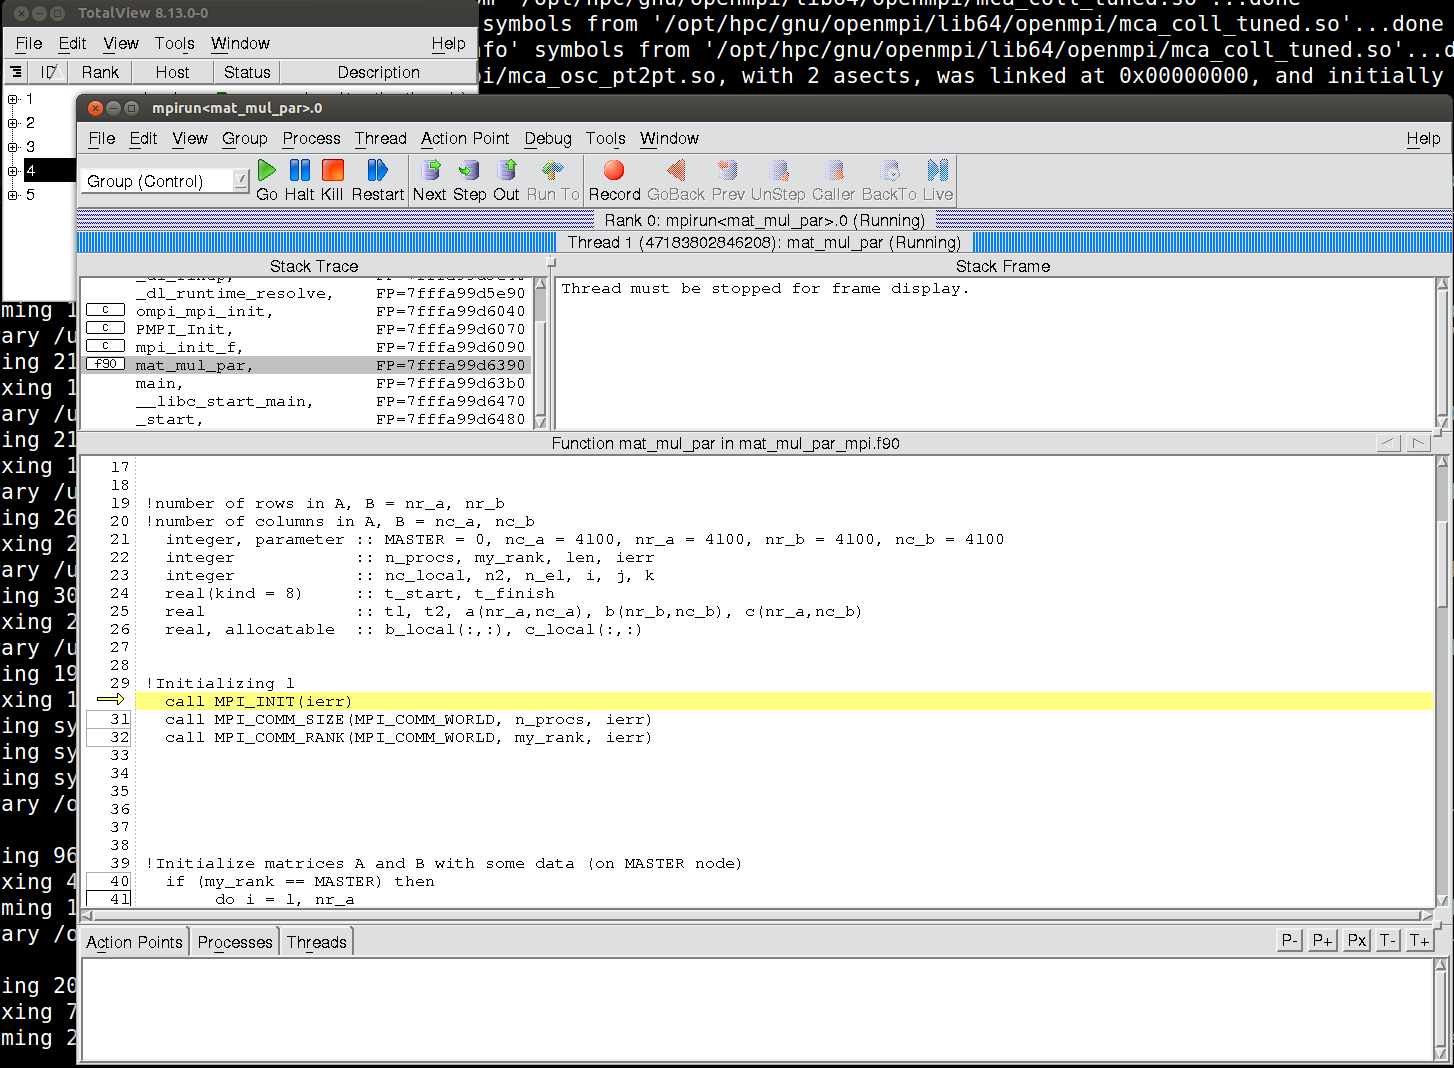
Now, you can add breakpoints to your code by clicking on any of the line numbers contained in a box. You can also drill down to your other functions by right-clicking on a function and selecting dive. In the following example, two breakpoints are inserted before and after the MPI_BCAST. When you click Go the execution will pause at the breakpoint and you will be able to check variable values by hovering your mouse over any variable names or right-clicking and choosing dive. Arrays will be opened in new windows. Another very nice feature is the ability to view the value of a variable across all the processes by selecting Across Processes after right-clicking.
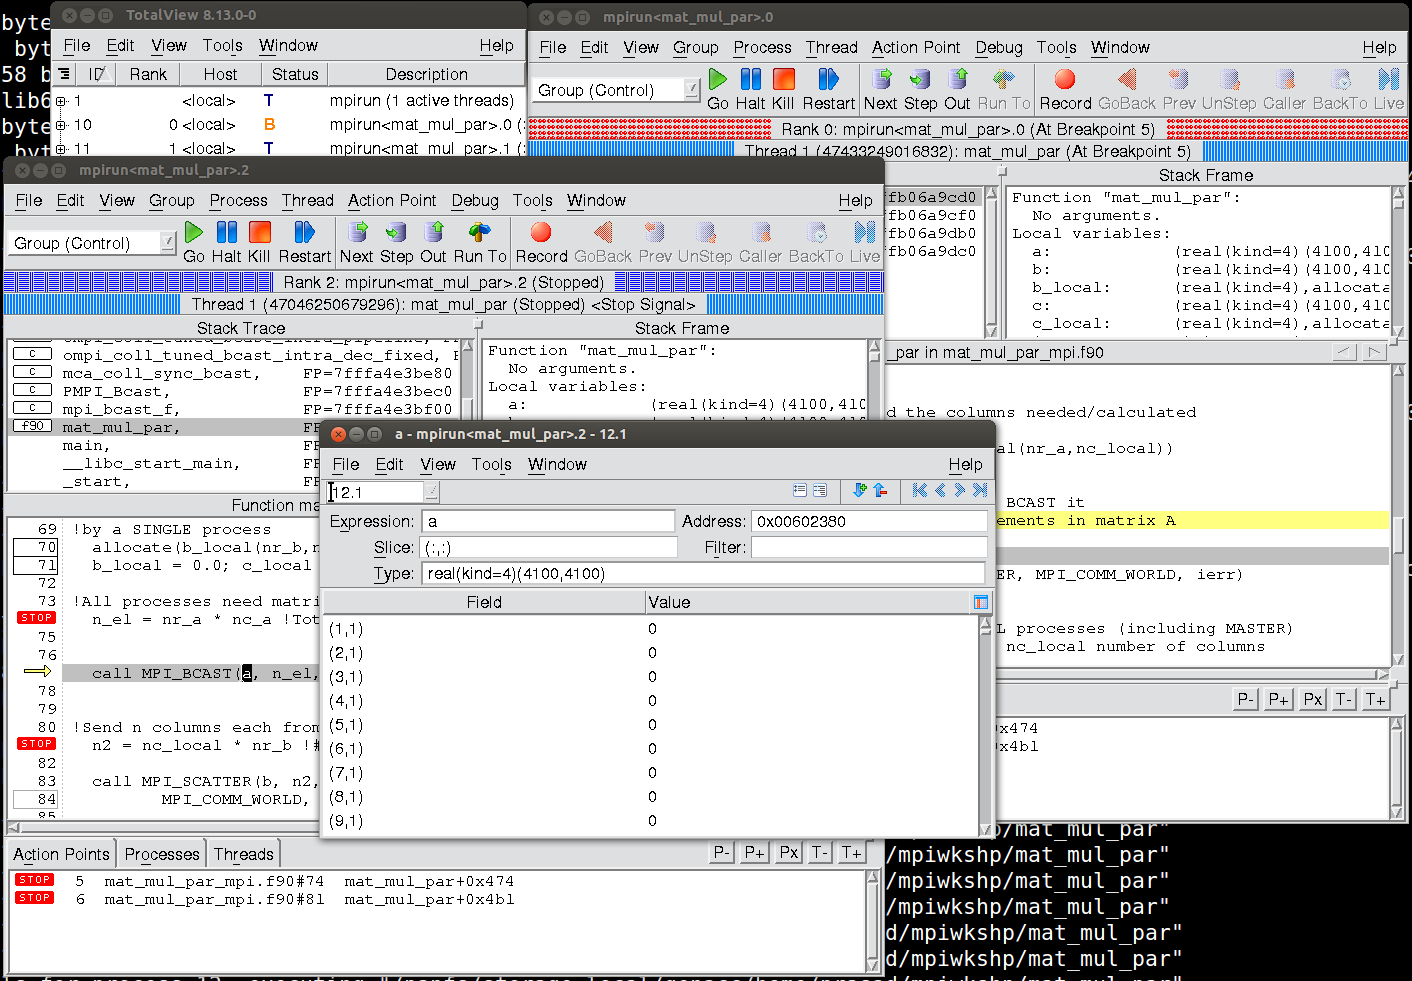
The process window is showing the master node and you can look at other processes by selecting a different a process in the root window and right-clicking and choosing Dive in new window. A separate window will open as shown above.
TotalView allows you to look at the run-time state of your MPI program's message passing by selecting Process Window >Tools Menu > Message Queue. However, only pending or unexpected messages are shown in this window. A graphical representation of this information can be obtained from Process Window>Tools Menu > Message Queue Graph.
For more information, please refer to the official documentation.