TAU
Introduction
TAU is a powerful performance analysis and tracing tool for serial and parallel applications created with Fortran, C++, C, python, Java and many other languages. TAU can be used to find the amount of time spent on each function, subroutine, loop, or phase, measure speed (FLOPS), measure time spent on I/O and bandwidths, find memory utilization during different stages of execution of a code or a selected portion of a code, find memory leaks in C/C++ codes, how a given application scale and much more. In addition, we have configured TAU with PAPI (Perforamce API) so that one can measure different hardware performance counters (to find cache misses for example). It also provides various utilities to visualize and analyze measured performance data. Following is a brief introduction to using TAU. Please refer to TAU documentation for more information.
Using TAU on HPC login node
As TAU is used to profile parallel applications, you need to load a parallel module (one of gnu-openmpi, gnu-mvapich2, intel-openmpi, etc) first. You can load TAU module after that. For example,
module load gnu-openmpi
module load tau
TAU supports dynamic (library-based) and source-level instrumentation. The advantage of dynamic instrumentation is that it does not require to recompile your application. However, it can only provide profiling details of MPI library calls. The compiler based instrumentation is done by compiling your application with TAU provided compiler. This is necessary to take full advantage of all instrumentation options provided by TAU.
Dynamic instrumentation
This is done by running your application with tau_exec. If you run your application (say, a.out) as,
mpirun -np 4 a.out
simply replace it with,
mpirun -np 4 tau_exec a.out
to dynamically instrument it. This will produce profile data of MPI calls (one profile file per each process). The files names would look like profile.0.0.0, profile.1.00, etc. You can visualize and analyze this data as described in here.
Source based instrumentation
TAU provides the scripts tau_f90.sh, tau_cc.sh, and tau_cxx.sh to instrument and compile Fortran, C, and C++ programs respectively. If you normally compile your Fortran code as,
mpif90 -o mycode mycode.f90
replace it with,
tau_f90.sh -o mycode mycode.f90
to instrument it with TAU. When you load the tau module, it will load a TAU Makefile for you. You can use this Makefile for general instrumentation or overwrite the TAU_MAKEFILE variable with any other Makefile provided in the same path. For example,
export TAU_MAKEFILE=/gpfs/research/software/hpc/gnu/openmpi/tau/x86_64/lib/Makefile.tau-papi-mpi-pdt-trace
Note that this is only necessary if you want to do some special purposes as a default makefile is already loaded by the module. After compiling, you can run it with mpirun the same way you used your code before.
Profiling with TAU
Although you can simply run a TAU instrumented code with mpirun, additional steps are necessary to control it and only measure what is necessary. This is important as profiling always adds overhead to your code. For example, if want to measure the speed of your code, then other instrumentation options need to be turned off. This is done via environment variables. Some examples are,
| Environement Variable | Remarks |
|---|---|
| PROFILEDIR | Directory where profile files will be saved |
| TAU_PROFILE=0 or 1 | Turn on/off profiling |
| TAU_VERBOSE=0 or 1 | Stderr contains TAU debugging information |
| TAU_THROTTLE=0 or 1 | Attempts to reduce TAU overhead by turning off instrumentation for frequently called routines |
| TAU_COMPENSATE=0 or 1 | Attempts to approximate and subtract out the instrumentation overhead from the reported metrics |
| TAU_COMM_MATRIX=0 or 1 | Collects details information on point-to-point communication for MPI ranks |
| TAU_TRACE=0 or 1 | Collects tracing information instead of profile information. Use TRACEDIR to specify a directory to store trace data |
| TAU_CALLPATH=0 or 1 | Generates a call path information for profiles |
| TAU_CALLPATH_DEPTH=N | Where N is a positive integer |
| TAU_TRACK_HEAP=0 or 1 | Measures heap on function entry and exit |
| TAU_TRACK_MESSAGE=0 or 1 | Collects detailed information about message sizes |
A complete list and more information can be found here. Note that,
export TAU_THROTTLE=0
will generate a full profile on the application with significant overhead. TAU_THROTTLE=1 turns off instrumentation in routines that execute over 100000 times (set by variable TAU_THROTTLE_NUMCALLS) and take less than 10 microseconds of inclusive time per call (set by variable TAU_THROTTLE_PERCALL). Refer to the TAU user guide for more information.
Tracing vs. Profiling
Profiling provides a picture of your application over its entire runtime. However, if you need to track what is happening over time, you need to use tracing by defining necessary environment variables.
export TAU_TRACE=1
export TRACEDIR=<a directory to store trace data>
Note that tracing adds significant overhead to the code. Visualizing tracing data is discussed here.
Selective instrumentation
An application often have large number of functions and subroutines. A user may not want to instrument all these routines and only want to look at certain functions. This is called selective instrumentation. One needs to create a file (say, select.tau) describing what loops/functions/subroutines needs to be instrumented or ignored and set TAU_OPTIONS environment variable to point to this file.
export TAU_OPTIONS="-optTauSelectFile=select.tau"
Following is an example select.tau file which instructs TAU to ignore the function swap subroutine and instrument all loops and file I/O in gauss subroutine in the gauss_solve.f90 code.
BEGIN_EXCLUDE_LIST
SUBROUTINE swap(a,b)
END_EXCLUDE_LIST

BEGIN_INSTRUMENT_SECTION
loop file="gauss_solve.f90" routine="SUBROUTINE gaussj(a,b)"
io file="gauss_solve.f90" routine="SUBROUTINE gaussj(a,b)"
END_INSTRUMENT_SECTION
Using Hardware Counters
At RCC, we have installed PAPI and configured it with TAU. Therefore, it is possible to use hardware counters (up to 25 at a time) to profile the execution of an application. Some examples are,
export COUNTER1=GET_TIME_OF_DAY #To measure runtime
export COUNTER2=PAPI_L1_DCM #To find level 1 cache miss
export COUNTER3=PAPI_L2_DCM #To find  level 2 cache miss
export COUNTER4=PAPI_FLOPS #To measure FLOPS
A complete list can be found here . Each counter will generate a seperate directory and set of profiles (one per each process). As you can see, this creates overhead and simultaneous use of several counters should only be done for debugging.
Visualizing and Analyzing profile data
TAU will generate a profile file per each node. This information can be directly viewed using the tool pprof. For example,
$ pprof
Reading Profile files in profile.*

NODE 0;CONTEXT 0;THREAD 0:
---------------------------------------------------------------------------------------
%Time    Exclusive    Inclusive       #Call      #Subrs  Inclusive Name
              msec   total msec                          usec/call
---------------------------------------------------------------------------------------
100.0          130       29,478           1        6008   29478463 MAIN
 94.3       27,798       27,798        2000           0      13899 MPI_Recv()
  4.1        1,207        1,207           1           0    1207903 MPI_Init()
  0.5          155          155           1           0     155681 INITIALIZE
  0.5          135          135        2000           0         68 MPI_Bcast()
  0.1           41           41        2003           0         21 MPI_Send()
  0.0            8            8           1           0       8541 MPI_Finalize()
  0.0        0.006        0.006           1           0          6 MPI_Comm_rank()
  0.0        0.002        0.002           1           0          2 MPI_Comm_size()
---------------------------------------------------------------------------------------
Note that you need to be in the same directory as the profile files are in.\
You can graphically view your data using the tool paraprof. This will open a GUI window with all profile information as shown below: 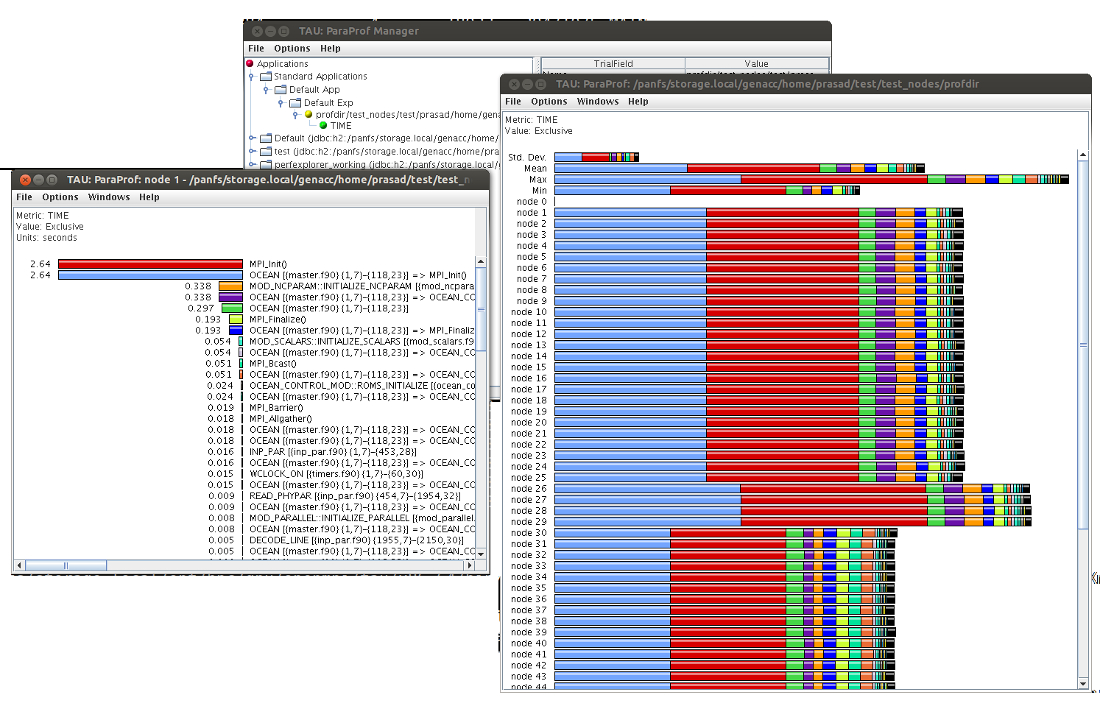
You can see the data on each node by simply clicking on the node number on the main window. If you have set export TAU_TRACE=1, instead of profiling, then you can visualize tracing data with the tool jumpshot. Simply run following commands to run jumpshot.
tau_treemerge.pl
tau2slog2 tau.trc tau.edf -o tautrace.slog2
TAU Workshop
We presented more details about profiling/tracing and TAU usage in our first TAU workshop and the slides can be found here.